Detecting a performance issue on the main thread
This tutorial guides you through identifying main thread delays in your apps using the Kotzilla Platform.
Issue context
A component resolution is running on main thread for more than 100 ms. ANRs (Application Not Responding) occur when the main thread is blocked for too long, making the app unresponsive and causing it to freeze. Common causes include heavy computations or synchronous operations running on the main thread.
Why it matters?
Main thread blockages severely degrade the user experience, slowing down the responsiveness of your app, which can lead to negative reviews, higher uninstall rates, and reduced app store rankings
Suggested user resolution actions
To address these main-thread blockages, aim to reduce time-consuming components on the main thread, particularly main thread resolution times exceeding 100 ms.
- Monitor for blocking operations: Use the Kotzilla Platform to detect tasks on the main thread that exceed 100 ms.
- Background thread offloading: Move blocking tasks like I/O operations or data processing off the main thread using background processing techniques.
- Refactor code: Simplify or optimize complex methods to minimize main thread impact.
- Offload heavy tasks: Use Koin to ensure that dependencies handling heavy computations or I/O operations are executed on background threads
- Optimize dependency configuration: Ensure no heavy tasks are performed during dependency creation in Koin modules.
Prerequisites
In this tutorial, we will be using the NowInAndroid app as an example. Before you begin, ensure you've completed the first two steps of the Get started with Kotzilla Platform
Step 1 - Simulate a blockage on the main thread
To observe the effects of blocking on the main thread, we’ll simulate a 1-second delay in MainActivityViewModel. This delay will serve as an example of a blocking operation impacting the app’s main thread performance.
Here’s the code to introduce a 1-second delay in the MainActivityViewModel:
class MainActivityViewModel(
    userDataRepository: UserDataRepository,
) : ViewModel() {

    init {
        // Simulate a main-thread block with a 1-second delay
        Thread.sleep(1000)
    }
Step 2- Create user sessions to capture app execution data.
With the simulated delay added, create a user session that will allow the Kotzilla SDK to capture and display the issue.
Run the Now In Android app as described in this guide to simulate a repeatable sequence of interactions. Repeat this three times to create consistent data on Kotzilla Platform.
Step 3- Investigate root cause of issues
With the simulated delay in place, the Kotzilla Platform now automatically detects a main thread performance issue on a ViewModel of the app that is taking more than 100ms to resolve. You can quickly view and investigate these issues directly within your IDE using the Koin IDE Plugin.
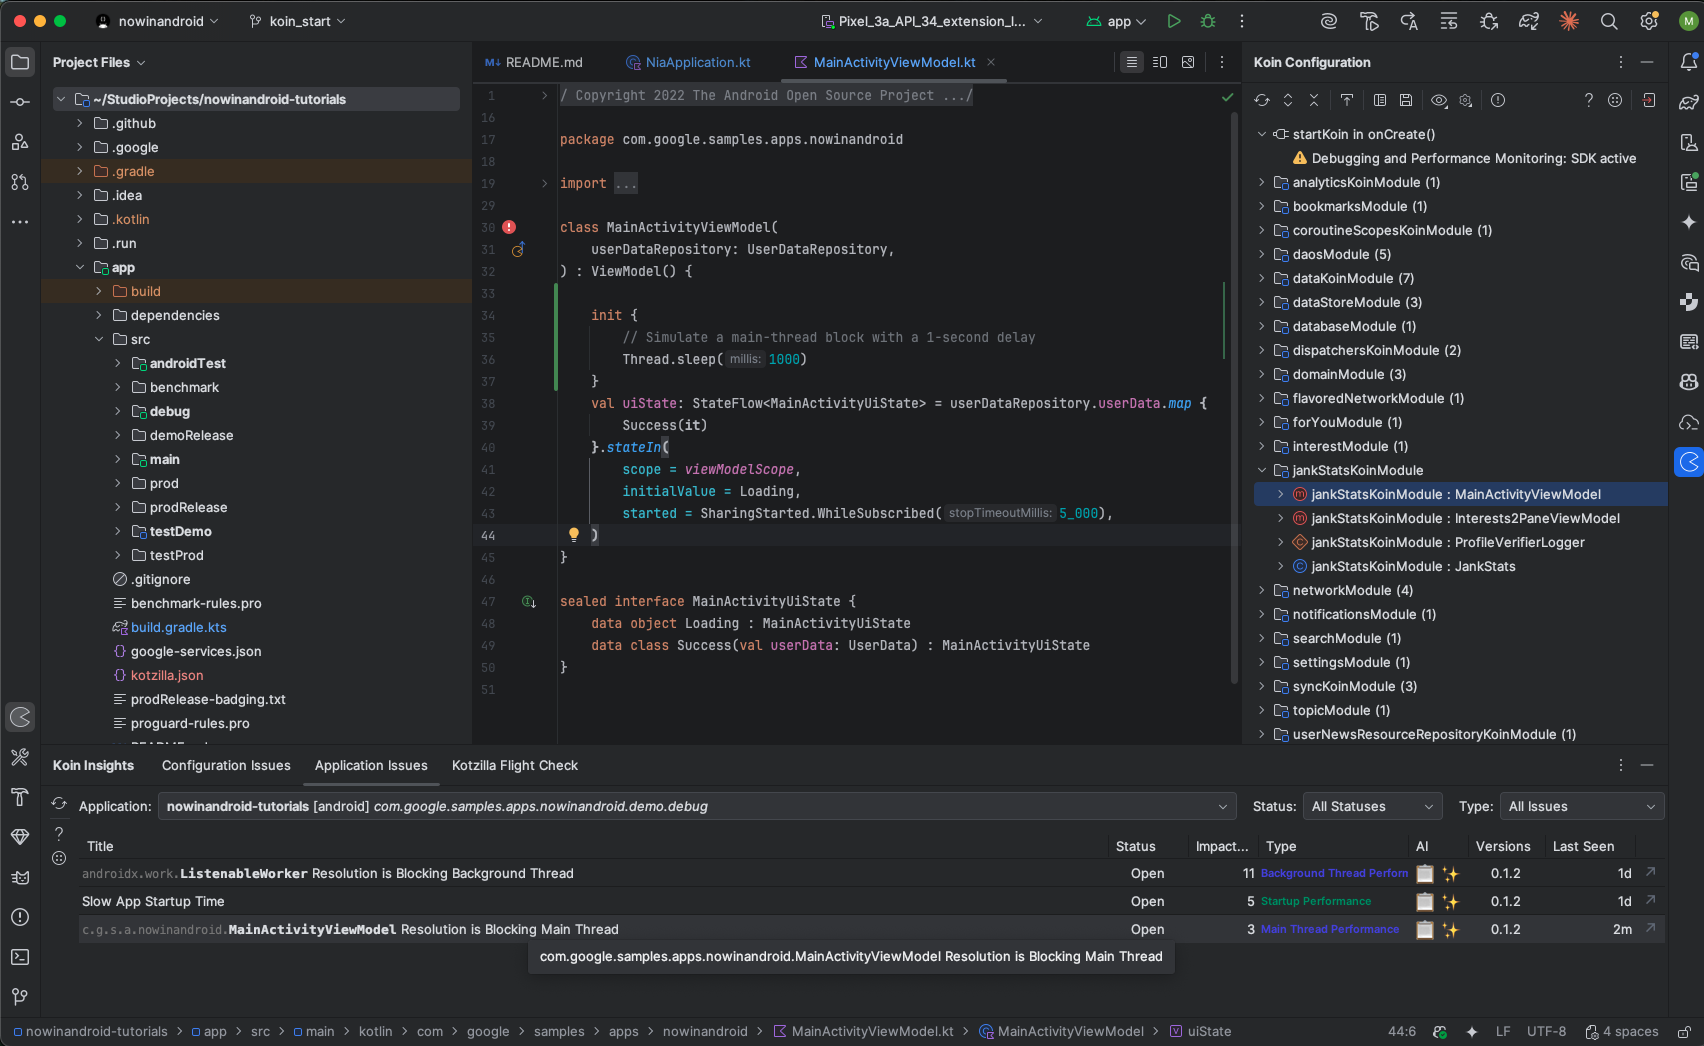
3.1 View issues in the Koin IDE Plugin
- Open the Issues Panel in the Koin IDE Plugin within your development environment (Android Studio or IntelliJ)
- Click on the Application Issues tab
Here, you will see a list of automatically detected issues, including the main thread blockage simulated with the 1-second delay in MainActivityViewModel
3.2 Investigating the root cause of issues
To investigate the details of this issue double-click on the
MainActivityViewModel Resolution is Blocking Main Thread issue in the Koin IDE Plugin. This will redirect you to the Issue Details view in the Kotzilla Console.
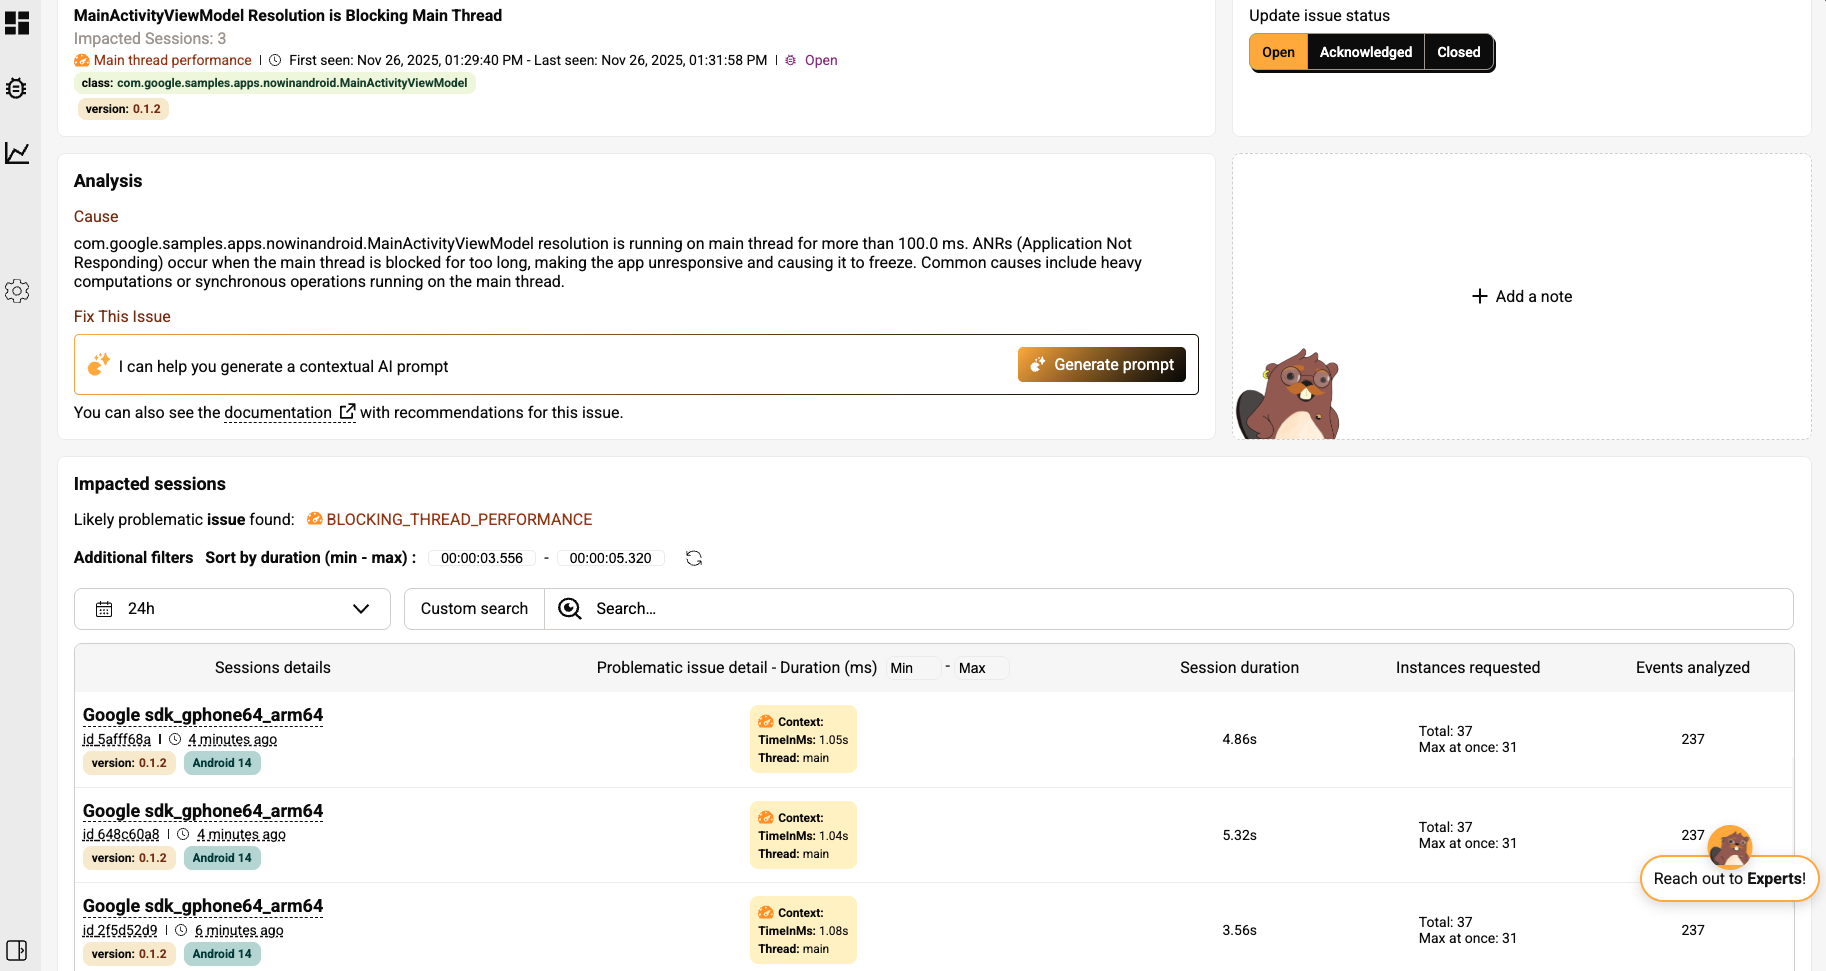
Here, you will see:
- A list of 3 impacted user sessions.
- A detailed description of the issue, including how the resolution of
MainActivityViewModelis blocking the main thread.
3.3 User session analysis to trace the main thread blockage
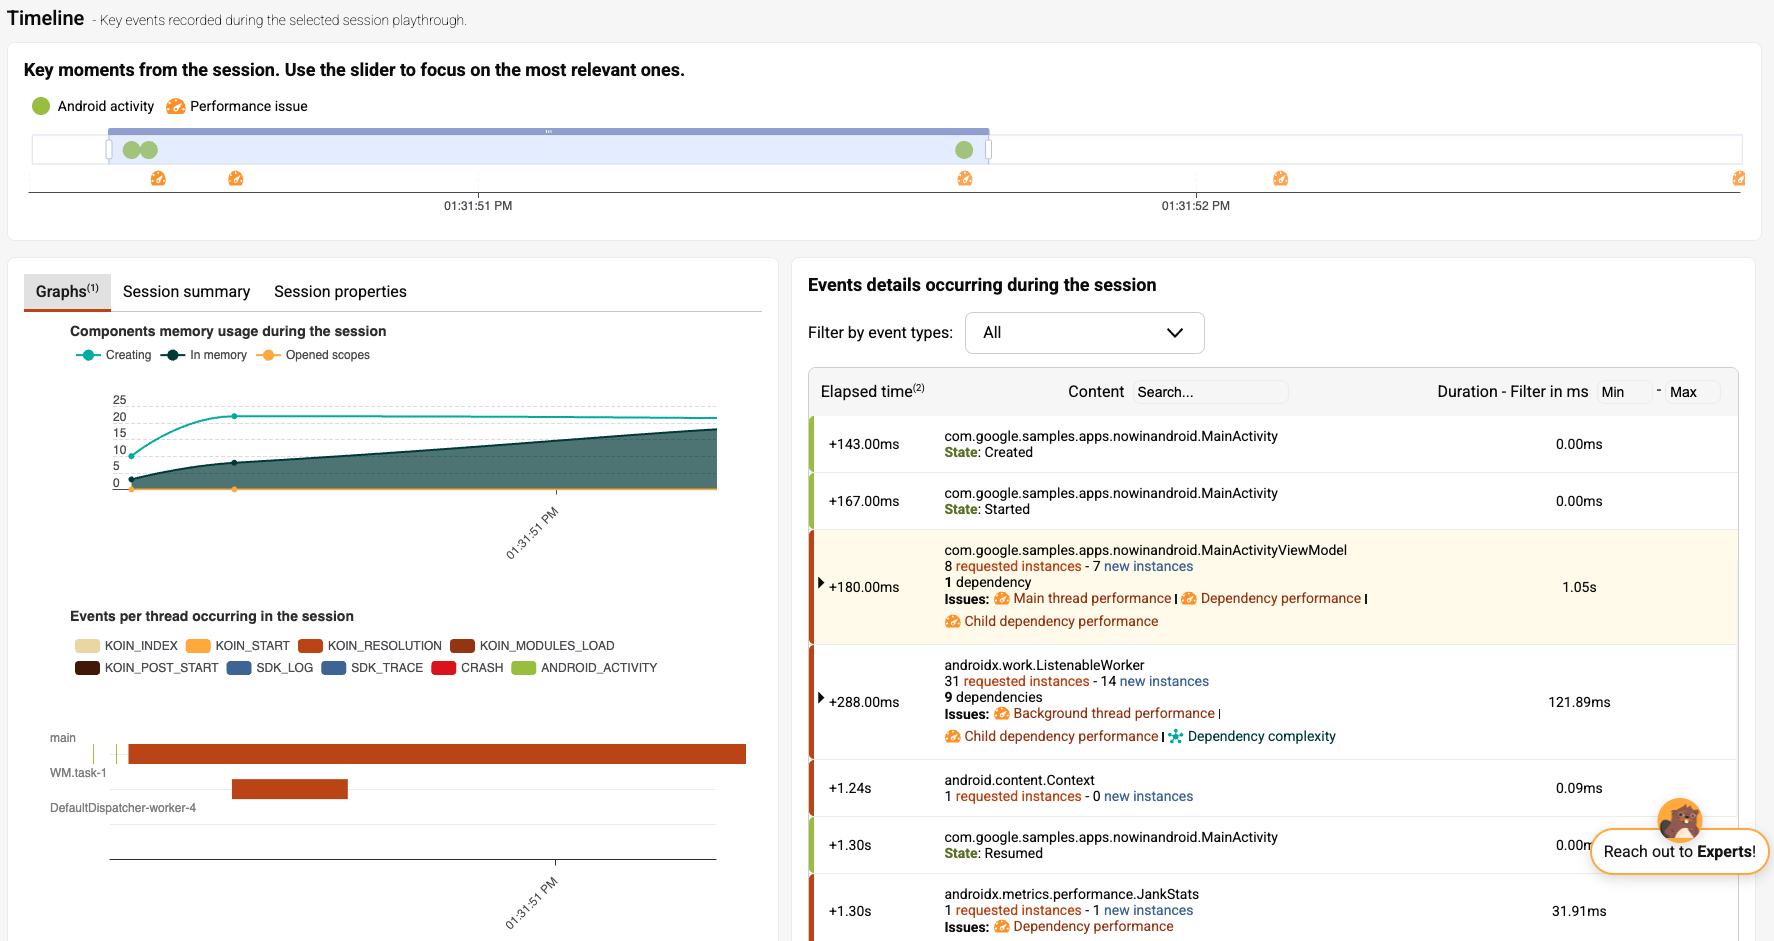
Click on the first impacted user session to drill down into the specific events and components related to the issue. This will take you directly to the Timeline View, where you will observe:
- The resolution of MainActivityViewModel taking 1,05s
- How the delay affects the screen flow, particularly the transition between the
startedandresumedstates of the main screen. - The 1-second delay on the main thread caused by the
MainActivityViewModelresolution
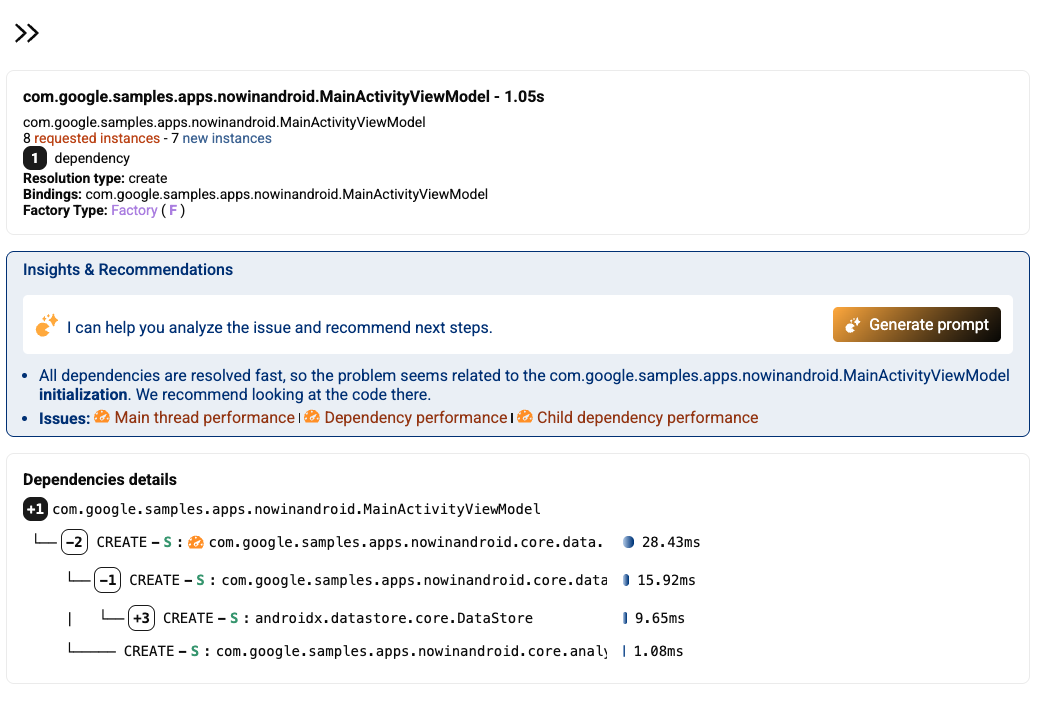
Click on the MainActivityViewModel in the event sequence. A tree graph view will appear showing the child nodes involved in the ViewModel’s resolution. We observe that the issue is not with the dependencies themselves, which are resolved quickly, but rather occurs during the initialization logic of the ViewModel.
Step 4- Fix a main thread performance issue
If you’re using an AI coding assistant in your Android development, you can rely on Kotzilla’s contextual prompt generation to help you fix this issue efficiently.
Otherwise, you can follow our recommended manual steps
4.1 Generate a contextual prompt for the issue
You can generate contextual fix prompts either from the Koin IDE Plugin or directly from the Kotzilla Console. In this example, we’ll use the IDE Plugin to create the prompt and execute it with your AI coding assistant:
- Open the Application Issues tab of the Koin IDE Plugin in your Android Studio
- Select the issue
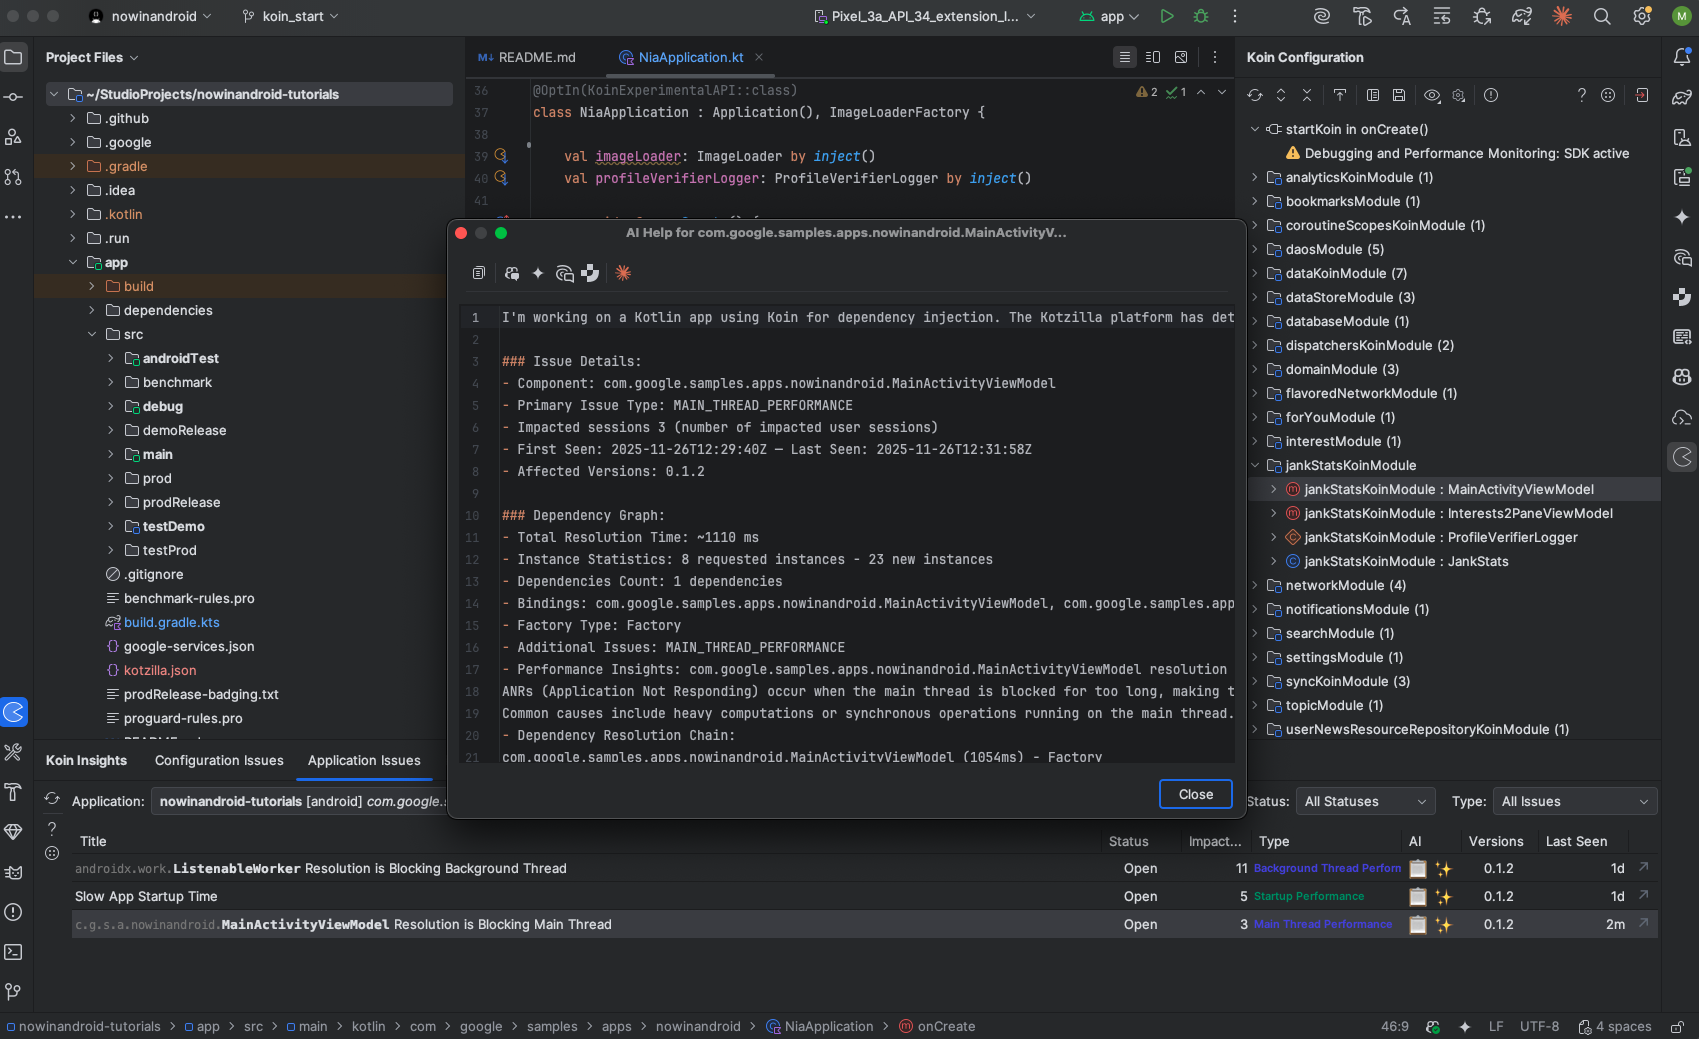
MainActivityViewModel Resolution is Blocking Main Thread - Click on the AI icon on the right to generate and view the prompt
The plugin will generate a ready-to-use prompt with all the necessary context so your AI coding assistant can suggest fixes. Each prompt includes the impacted components, dependency chains, and performance insights.
4.2 Execute the fix with your preferred AI Coding Assistant
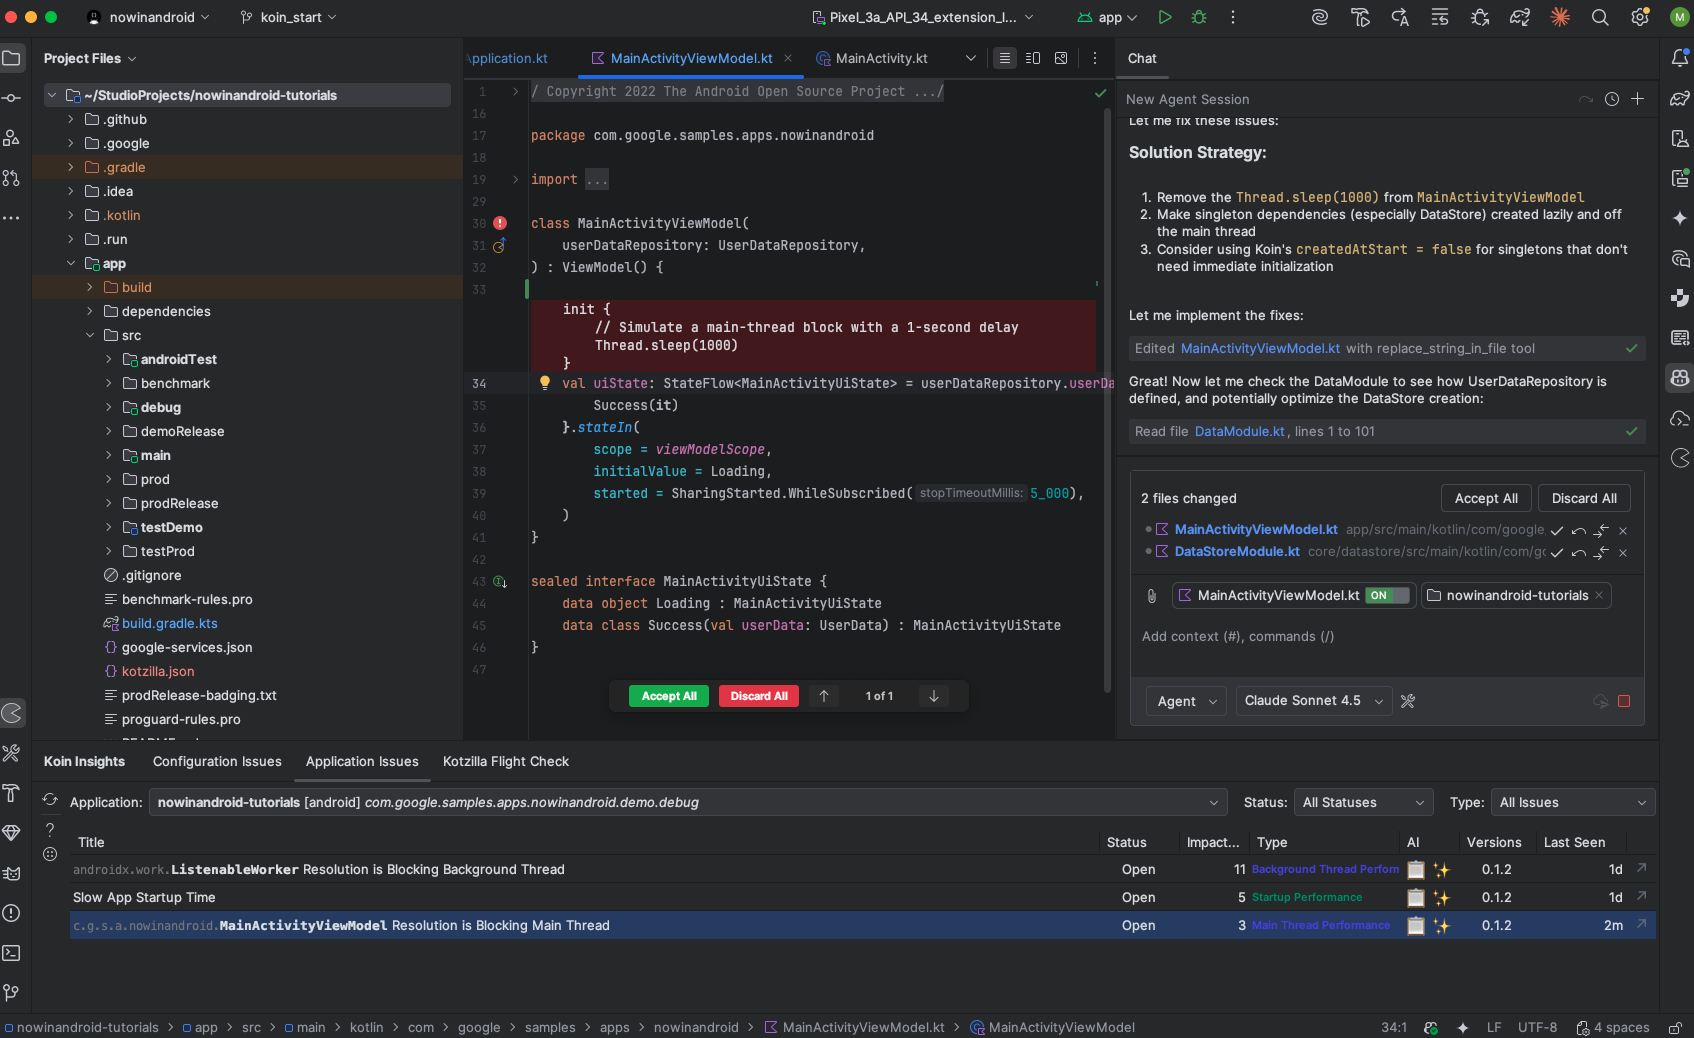
You can now copy the generated prompt and execute it using the AI Coding Assistant of your choice in the IDE. In this example, we use GitHub Copilot with the Claude Sonnet 4.5 model:
- Open your AI assistant panel (i.e, Github Copilot)
- Paste the generated prompt
- Run it with Agent Mode (or equivalent), so the assistant can apply code changes directly with full project context
- Review and approve the changes
Key Takeaways
By introducing a 1-second delay inside MainActivityViewModel, we saw how this ca slow down the first screen rendering. With the Kotzilla Platform and the Koin IDE Plugin, we quickly identified the problematic resolution, examined the affected sessions, and traced the slowdown directly to the ViewModel’s initialization path.
Once detected, the issue can be fixed using Kotzilla’s contextual prompts with your AI coding assistant or by applying the manual optimization steps provided. Reducing heavy work in ViewModel initialization results in faster UI readiness, smoother navigation, and a improved user experience.